
On the campaign trail recently I’ve been talking about how much Georgia spends on education and how that relates to outcomes for our children.
I put together a spreadsheet for you so you can see Georgia’s spending on education from Fiscal Years 2005 through the current Fiscal Year 2014. I have graphed Georgia’s education spending, the federal money Georgia spends on education and the total budget for our state. Here’s that graph:

Notice anything?
Georgia’s total budget took quite a hit from 2008 to 2010 (the top yellow line). Georgia’s state funding for education dipped during that same time frame (the blue line) but took nowhere near the hit that the entire state was forced to endure. Additionally, the federal government stepped in and made up for most of the decline with stimulus funds. The grey line shows total state and federal education spending.
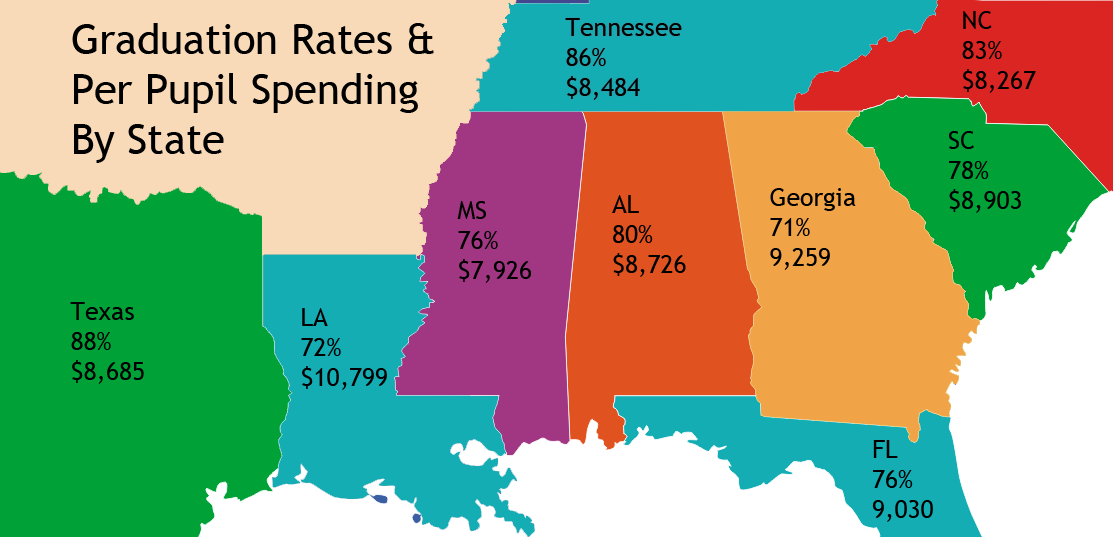
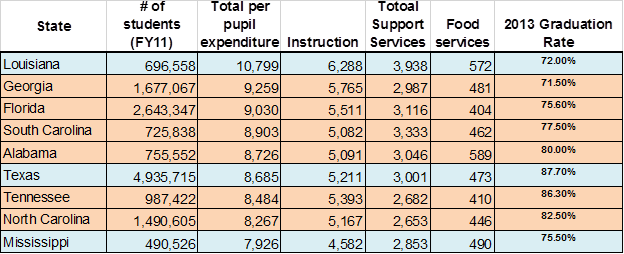
What’s the real story behind Georgia’s education system and funding? Every state that borders Georgia spends less per pupil and has a higher graduation rate. For the record, since 2012 (for the 2010-11 school year) the graduation rate is calculated the same in every state. See my chart below for the data – border states are highlighted in peach and other notable states are highlighted in blue. It’s worth noting our two lowest spending border states have the highest graduation rates – Tennessee and North Carolina.
Sources and Citations
